If you were to ask most staffing managers and executives how their teams are performing, most can give you precise numbers of their weekly gross profit, monthly direct-hire fees and average margins, but many have a hard time giving specific details around some of their teams performance metrics.
There are a list of Key Performance Indicators that Staffing Managers should be looking at – Time to Submit, Time to Fill, Submit to Hire Ratio, Cost to Apply, Cost to Place, and several others important metrics. One reason why many managers do not have a clear picture of these metrics is that the data can sometimes be hard to track depending on the reporting capabilities of your Applicant Tracking System (ATS) as well as accuracy issues with the data (or lack of data) that your team is entering into your system.
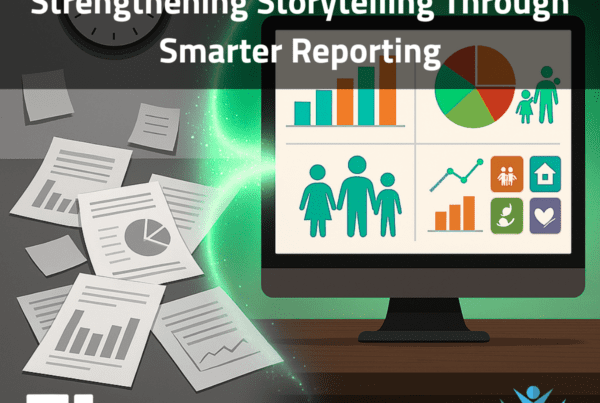
Gaining an accurate snapshot of your team’s performance is critical in order to make the right decisions on how to manage your business. How many more placements could you have if you decreased time to submit by just one business day? What if you could respond to 20% more requisitions? Are there any seasonal or cyclical trends to you can see from your historical data? These are often questions that can be answered through the exercise of extracting and analyzing your data into a dashboard that illustrates past trends and allows you to predict future trends.
Talk to an NLP Logix Leadership Team member to see how your data stacks up.
Customization is Key
Every Staffing Agency has a unique business model, process and value proposition in the market. Your data visualization dashboards should reflect that uniqueness. Some agencies will focus on volume application conversions, where certain volume KPIs are at the forefront. Other, more boutique or Executive Search Firms, will focus on higher level placement, at a lower volume. In this case, margin and profitability is key. These firms may be measuring Cost to Place or Customer Satisfaction metrics.

Many staffing firms also have several different divisions or areas of focus. It is important not to group that data together, but instead, segregate it based on the line of business as metrics and expectations can vary based on the type of candidates and jobs you are focused on. This will give you a clear picture of how each line of business is performing and will not dilute the numbers.
Especially during times of economic uncertainty, the importance of having visibility and an understanding of your data is critical. It is that understanding that will guide you to determine whether you need to reduce the size of your recruitment workforce, or to know when to grow your recruiter headcount, without sacrificing profitability. Having a clear picture of your key metrics will help you set a benchmark for success, and guide your decision making process.
Leverage Data to Influence Change
Data is also key in managing stakeholder relationships and influencing leadership. Without data, you can spend hours discussing options for your strategic plan and recruitment decisions. With data, you have a clear road map, telling you a story of what has worked, what hasn’t worked and where you should take your business. Data also removes any bias or subjectivity into making business decisions.
There are a few key areas that you should discuss with your company’s leadership team and agree upon, before starting your Analytics journey:
- What metrics will we measure?
- What does a successful KPI of each metric look like?
- At what cadence will we pull and review this data?
- Who is responsible for what data set?
- What determining factors from the data will lead us to make key business decisions (when to hire up, reduce headcount)?
- What actions will we make if our KPIs for each metric are lower than (or greater than) we expected?

Standard Out-of-the-Box ATS Reporting is Not Enough
Many staffing leaders currently rely on the reporting capabilities of their current Applicant Tracking System (ATS), but often times these reports are limited, the data may be inaccurate, and the reports lack customization. Although some may be able to give you a high-level snapshot, most are not able to drill down into more detail to give you a true picture of your teams’ performance. They are also not able to show you trends over time or the effects of changes in certain metrics.
As more and more staffing firms and in-house recruitment teams continue to adapt a more data-driven approach to management, it is important that you are capturing and utilizing your data as much as possible.
At Matchpoint, we are obsessed with data. We help our clients visualize their data so that they can uncover relevant insights and make key recruitment decisions. One of the challenges we face when working with a new client is “cleaning” the data to make sure what is being analyzed is accurate. We work alongside our clients to understand their data, remove inaccurate figures and identify any outliers that could skew their metrics. By doing this, we can give an accurate analysis of their current performance metrics.
To learn more about our Matchpoint Staffing Analytics Dashboard capabilities, contact a team member today.


